目录
数据可视化

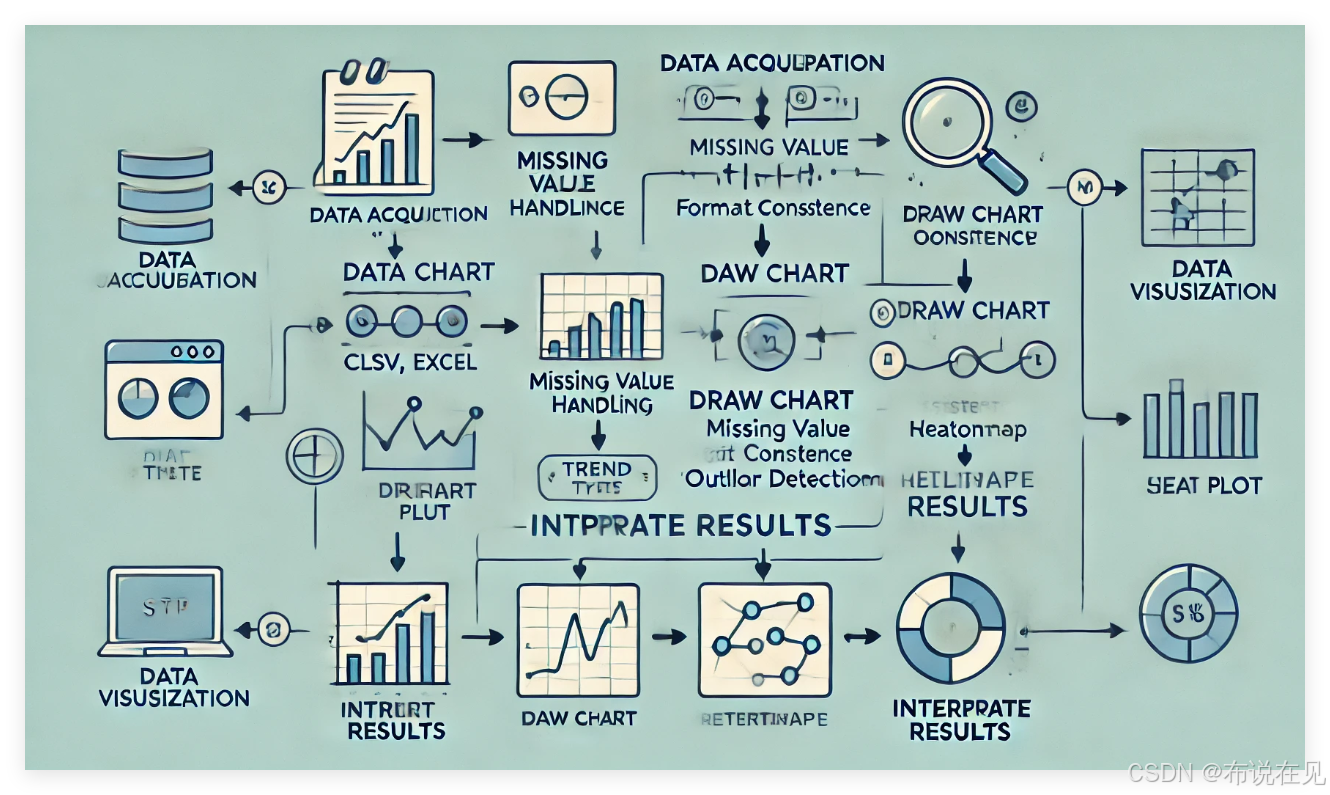
是通过图形展示数据的一种方式,能够帮助我们快速理解数据的内在规律和趋势。整个数据可视化流程可以分为以下几个步骤:
获取数据:数据可能来自不同的来源,比如文件(CSV、Excel)、数据库、API 等。数据通常会存储为结构化或非结构化的形式。
数据清洗:实际数据通常会有缺失值、不一致的格式等问题。在可视化之前,我们需要清理数据,处理缺失值、异常值,确保数据质量。
选择合适的图表类型:根据数据类型和分析目的,选择适合的数据可视化图表。常见的图表类型有折线图、柱状图、散点图、热力图等。
绘制图表:使用编程语言和数据可视化工具来生成图表。在 Python 中,常用的可视化工具有 Matplotlib、Seaborn 等。
解释结果:通过图表直观地展示数据的趋势、分布或关系,从而得出结论并做出决策。
1.气温数据可视化
import pandas as pd
import numpy as np
import matplotlib.pyplot as plt
import seaborn as sns
plt.rcParams['font.family' ] = 'Arial Unicode MS'

np.random.seed(0)
dates = pd.date_range(start='2024-03-01',periods=31,freq='D')
temperature1 = (31,30,31,32,35,35,36,35,31,33,30,25,29,25,30,34,36,38,32,34,31,35,35,31,35,36,31,32,36,35,29,)
plt.figure(figsize=(16, 6))
temperature2 = (20,25,22,26,19,19,29,19,19,19,15,19,21,19,19,21,26,27,19,19,30,28,29,19,19,21,34,23,19,19,20)

plt.figure(figsize=(16,6))
plt.plot(dates,temperature1,label='气温',color='blue')
plt.xlabel('日期')
plt.ylabel('气温(摄氏度)')
plt.title(' 3月气温走势(最高)')
plt.legend()

plt.figure(figsize=(16,6))
plt.plot(dates,temperature2,label='气温',color='blue')
plt.xlabel('日期')
plt.ylabel('气温(摄氏度)')
plt.title(' 3月气温走势(最低)')
plt.legend()


plt.figure(figsize=(16, 6))
plt.scatter(dates,temperature1,label='气温',color='red',marker='o',s=6)
plt.xlabel('日期' )
plt.ylabel('气温 (摄氏度)')
plt.title( ' 3月最高气温走势 (散点)')
plt.legend()


plt.figure(figsize=(16,6))
plt.scatter(dates,temperature2,label='气温',color='red',marker='o',s=6)
plt.xlabel('日期')
plt.ylabel('气温(摄氏度)')
plt.title(' 3月最低气温走势(散点)')
plt.legend()
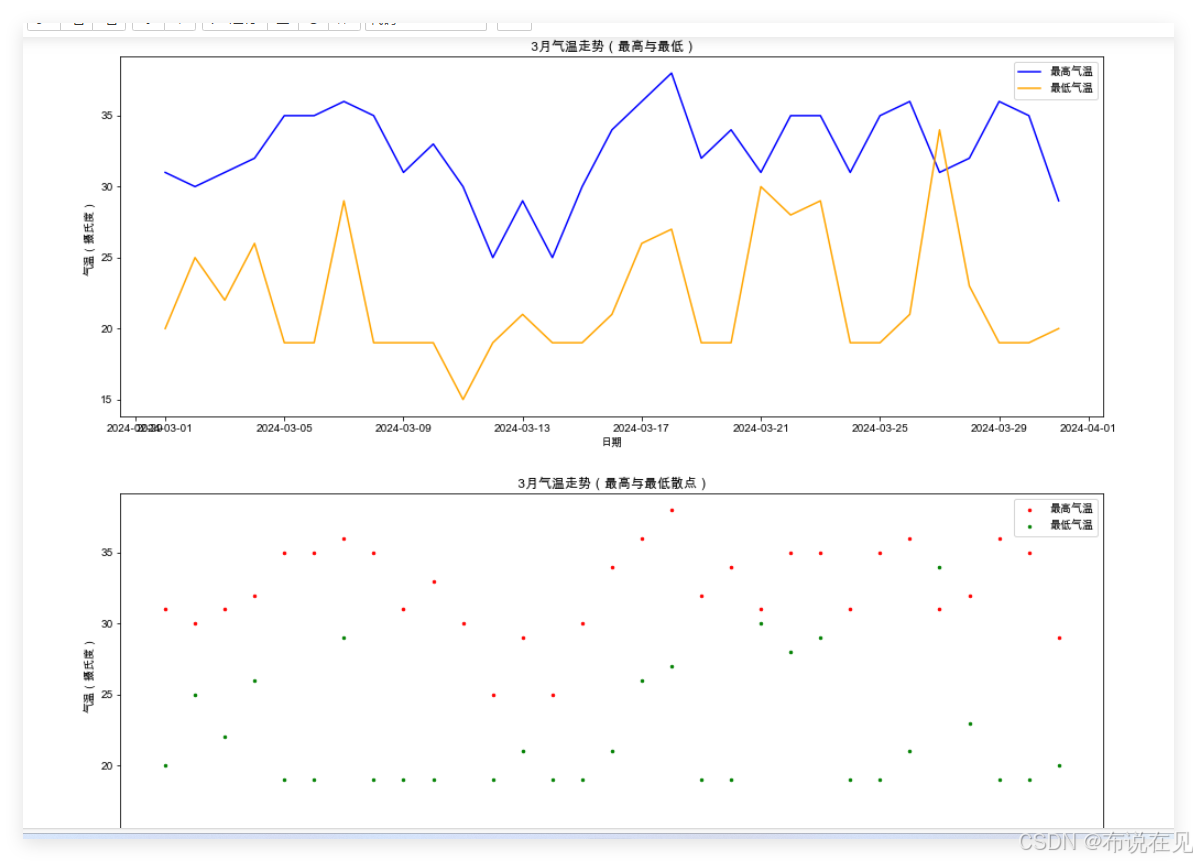
图片展示


通过 绘制了两组温度数据的折线图和散点图,分别对应 3 月份的每日最高和最低气温。代码逻辑看起来非常清晰,只是目前你为两组数据分别绘制了两张图。如果你想将最高和最低气温的变化趋势显示在同一张图上,可以通过以下方式修改代码:
将最高和最低气温合并绘制折线图:
plt.figure(figsize=(16, 6))

# 绘制最高气温
plt.plot(dates, temperature1, label='最高气温', color='blue')

# 绘制最低气温
plt.plot(dates, temperature2, label='最低气温', color='orange')

# 添加图例、标题和轴标签
plt.xlabel('日期')
plt.ylabel('气温(摄氏度)')
plt.title(' 3月气温走势(最高与最低)')
plt.legend()

plt.show()
将最高和最低气温合并绘制散点图:
plt.figure(figsize=(16, 6))

# 绘制最高气温的散点
plt.scatter(dates, temperature1, label='最高气温', color='red', marker='o', s=6)

# 绘制最低气温的散点
plt.scatter(dates, temperature2, label='最低气温', color='green', marker='o', s=6)

# 添加图例、标题和轴标签
plt.xlabel('日期')
plt.ylabel('气温(摄氏度)')
plt.title(' 3月气温走势(最高与最低散点)')
plt.legend()

plt.show()

通过这种方式,你可以在同一张图上对比最高和最低气温的变化情况,更直观地看到它们之间的差异。
2.销售数据可视化
销售数据可视化可以帮助你更直观地了解销售趋势、客户偏好以及其他关键业务指标。
几种常见的销售数据可视化方法及其适用场景:
折线图(Line Chart):
- 用途:展示销售额随时间的变化趋势,比如每日、每月或每季度的销售趋势。
- 适用场景:分析销售高峰期、淡季以及销售趋势的变化。
# 示例:每日销售额折线图
dates = pd.date_range(start='2024-01-01', periods=30, freq='D')
sales = np.random.randint(100, 500, size=30)

plt.figure(figsize=(12, 6))
plt.plot(dates, sales, label='销售额', color='blue')
plt.xlabel('日期')
plt.ylabel('销售额')
plt.title('每日销售额走势')
plt.legend()
plt.show()
柱状图(Bar Chart):
- 用途:展示不同时间段或类别的销售量。特别适合展示类别间的比较,如产品、区域或销售员的业绩。
- 适用场景:分析不同产品或区域的销售表现。
# 示例:按产品类别的销售额柱状图
categories = ['产品A', '产品B', '产品C', '产品D']
sales_by_category = [1500, 2000, 1800, 1200]

plt.figure(figsize=(10, 6))
plt.bar(categories, sales_by_category, color='green')
plt.xlabel('产品类别')
plt.ylabel('销售额')
plt.title('按产品类别的销售额')
plt.show()
堆叠柱状图(Stacked Bar Chart):
- 用途:展示不同类别的销售额占比,比如每个季度内各产品的销售额对比。
- 适用场景:展示多个产品或区域的销售占比。
# 示例:季度销售额堆叠柱状图
quarters = ['Q1', 'Q2', 'Q3', 'Q4']
product_A = [500, 700, 900, 800]
product_B = [300, 500, 600, 700]

plt.figure(figsize=(10, 6))
plt.bar(quarters, product_A, label='产品A', color='blue')
plt.bar(quarters, product_B, bottom=product_A, label='产品B', color='orange')
plt.xlabel('季度')
plt.ylabel('销售额')
plt.title('季度销售额(堆叠柱状图)')
plt.legend()
plt.show()
饼图(Pie Chart):
- 用途:展示某一时间段内不同类别或产品的销售额占比。
- 适用场景:分析不同产品、地区或客户群体的销售占比。
# 示例:不同产品销售占比饼图 product_sales = [3000, 2500, 1800, 1200] product_labels = ['产品A', '产品B', '产品C', '产品D'] plt.figure(figsize=(8, 8)) plt.pie(product_sales, labels=product_labels, autopct='%1.1f%%', colors=['blue', 'green', 'red', 'orange']) plt.title('产品销售额占比') plt.show()热力图(Heatmap):
- 用途:展示不同时间段和产品的销售表现。颜色越深表示销售额越高。
- 适用场景:分析销售数据的季节性变化或区域销售情况。
# 示例:按月份和产品的销售额热力图
sales_data = np.random.randint(100, 1000, size=(4, 5))  # 4个月,5种产品
sns.heatmap(sales_data, annot=True, cmap='Blues', xticklabels=['产品A', '产品B', '产品C', '产品D', '产品E'], yticklabels=['1月', '2月', '3月', '4月'])
plt.title('每月每个产品的销售额热力图')
plt.show()
散点图(Scatter Plot):
- 用途:展示销售额与其他变量(如客户、价格、库存)之间的关系。
- 适用场景:分析价格与销售额的相关性或其他变量的影响。
# 示例:价格与销售额的散点图
prices = np.random.randint(50, 500, size=30)
sales = np.random.randint(100, 1000, size=30)

plt.figure(figsize=(10, 6))
plt.scatter(prices, sales, color='purple')
plt.xlabel('价格')
plt.ylabel('销售额')
plt.title('价格与销售额的关系')
plt.show()
这些可视化方法可以帮助你深入分析销售数据的变化和模式,你可以根据实际的数据类型选择合适的图表类型。如果有具体的数据或场景,我可以帮助你设计更适合的可视化图表。
import pandas as pd
import numpy as np
import seaborn as sns
import matplotlib.pyplot as plt

# 设置中文字体
plt.rcParams['font.family'] = 'Arial Unicode MS'

# 随机生成数据
np.random.seed(0)
years = ['2019', '2020', '2021', '2022', '2023']
categories = ['PA', 'PB', 'PC', 'PD', 'PE']
data = np.random.randint(10, 100, size=(len(years), len(categories)))

df = pd.DataFrame(data, columns=categories, index=years)

# 1. 绘制热力图
plt.figure(figsize=(10, 6))
sns.heatmap(df, cmap='YlGnBu', annot=True, fmt='d', cbar=True)
plt.xlabel('产品种类')
plt.ylabel('年份')
plt.title(' 热力图')

# 2. 绘制堆叠柱状图
plt.figure(figsize=(10, 6))
bottom = np.zeros(len(years))
for category in categories:
    plt.bar(years, df[category], label=category, bottom=bottom)
    bottom += df[category]

plt.xlabel('年份')
plt.ylabel('数量')
plt.title(' 产品数量堆叠柱状图')
plt.legend(title='产品种类')
plt.show()
图片展示


通过热力图和堆叠柱状图的直观展示,可以得出以下结论:
整体趋势:
从热力图中可以看到,PA 和 PC 类产品在大部分年份中保持较高的销量,而 PB 类产品的销量相对较低。这可能意味着公司在 PA 和 PC 产品上具备较强的市场竞争力,而 PB 产品的市场表现有待提升。
堆叠柱状图展示了各年产品销售总量的变化。例如,2021 年的总销售量较低,可能由于市场因素或产品策略调整所致,而 2023 年的销售量明显增长,显示出产品策略的优化或市场需求的变化。
产品表现:
通过对比不同年份的销售数据,PA 和 PE 类产品在不同年份的波动较大,说明这两类产品的销量受到外部因素的影响较大。而 PC 类产品表现相对稳定,可能为公司提供了持续的收入来源。
总结
哇哦!库一定要提前下载哦!可以用国内的镜像源来下载库呢!加油,慢慢学,你一定可以的!
原文链接:https://blog.csdn.net/m0_67187271/article/details/143226029

此处评论已关闭